Data Analysis sample page
Scientists at Sunset Crater wanted to see if there was a relationship between the warming climate and the population of the scale insect. They organized their data onto a spreadsheet and created a graph to see if patterns or trends would be visible.
The months April through September readings were used for all the years of data. This is the normal life range of the scale insect. You can see that for each year, the average high temperature was recorded in Celsius, the amount of precipitation was recorded in centimeters for the months chosen and the scale density or average number of scale per needle was used (Scaden).
Unfortunately, even when this data is shown on a spreadsheet below, it is still very difficult to look for patterns that might tell us the relationship between these pieces of data.
| 1985 | T-max avg. Celcius | Precip. Sum | Scaden |
|---|---|---|---|
| 1986 | 26.64 | 18.808 | 2.97 |
| 1987 | 25.17 | 32.42 | 2.57 |
| 1988 | 25.62 | 19.566 | 6.11 |
| 1989 | 25.67 | 22.216 | 5.03 |
| 1990 | 27.49 | 12.52 | |
| 1991 | 25.97 | 25.56 | 1.83 |
| 1992 | 25.19 | 11.305 | 5.03 |
| 1993 | 25.4 | 26.95 | 1.63 |
| 1994 | 27.57 | 10.072 | 0.54 |
| 1995 | 27.74 | 23.852 | 2.21 |
| 1996 | 25.39 | 16.729 | 1.4 |
| 1997 | 27.11 | 18.309 | 6.78 |
| 1998 | 26.63 | 23.024 | 3.96 |
| 1999 | 25.17 | 23.48 | |
| 2000 | 25.46 | 34.788 | |
| 2001 | 28.33 | 13.167 | 4.26 |
| 2002 | 27.61 | 15.51 | 2.64 |
| 2003 | 28.12 | 13.571 | 9.95 |
| 2004 | 27.13 | 14.818 | 3.05 |
| 2005 | 26.66 | 16.281 | 3.62 |
| 2006 | 26.16 | 17.836 | 1.06 |
| 2007 | 25.7 | 25.601 | 0.95 |
| 2008 | 26.38 | 22.129 |
The next step would be to produce a graph that would give a picture of the data.
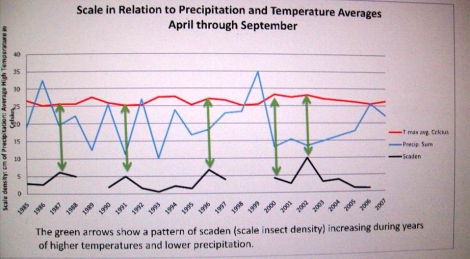
This data leads us to believe that with climate change at Sunset Crater, scale insects will increase to a level where infested trees would die. This actually happened in 2002 during one of the more significant droughts. Below is a picture of Sunset Crater trees in 2002. Notice the number of dead trees.
