Jobs & Economic Development Impact (JEDI) modeling summary
Economic impacts
The development of wind and solar power plants creates jobs, increases direct local spending on products and services for the plant, and increases indirect spending by those who receive wages or payments due to the plant’s operation. The plants also provide a stream of property tax, right-of-way, or other land payment revenue to the state, county, tribe or federal agency having land jurisdiction, as well as to any private entity whose land makes up part of the project’s footprint.
The JEDI model
These positive economic impacts can be quantified using the Jobs and Economic Development Impacts model developed by the National Renewable Energy Laboratory. This model is an input-output model, developed using data gathered from industry interviews, surveys of local businesses, and economic multipliers derived from the Minnesota-based IMPLAN group’s accounting software and state files. The model can be used to estimate economic impacts at the state or county level. For the purposes of this report, the model was run at the state level.
Basics of economic impacts and input-output modeling
The statewide economic impacts of renewable energy projects are directly related to the relative costs of the project development materials and processes, and their availability in the state. If there is a component or service for the construction or maintenance of the plant available in Arizona, the model assumes that it is used, whether this is actually the case or not. Thus, if the equipment for a concentrating solar plant costs more than an equivalent-size wind plant, then the total project cost is higher, and to the extent that materials for the plant are available in Arizona, the economic impact on the state is greater. The same is true for the labor involved in plant construction and maintenance. In addition, the land use expenses, such as lease arrangements, property taxes, and rights-of-way are included as default values in the model, and generally are higher for plants that use more of the actual surface area of the project boundary.
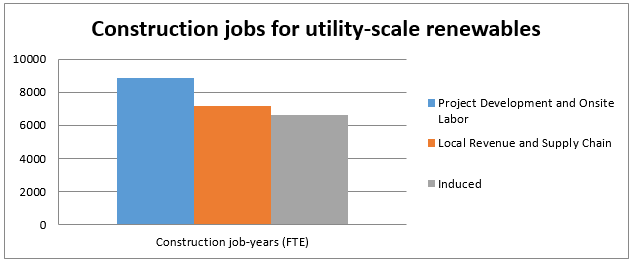
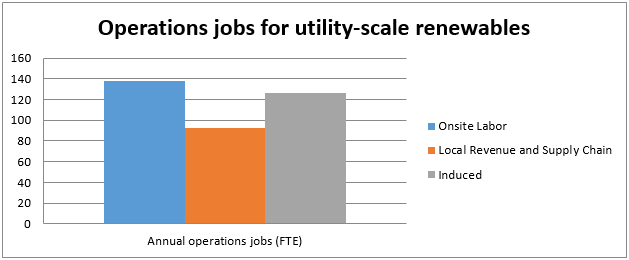
The model quantifies construction-phase and operation-phase impacts. Jobs, earnings, and output are distributed across three categories:
- Project development and onsite labor impacts: refers to the actual work and financial transactions related to the renewable energy project development, construction and operation onsite at the plant. Example: the job and paycheck of a road grader or wind turbine technician at a wind plant.
- Local revenue and supply chain impacts: refers to additional work or spending that takes place in the local area or in the supply chain statewide for the actual development, construction, or operation of the plant. Example: the purchase of local legal services or construction supplies from a firm in the state where a solar plant is built.
- Induced impacts: refers to the work or revenue resulting from local expenditures made by those individuals whose jobs are supported by the onsite or supply chain impacts. Example: part of the employment, wages, and revenue at a theater where wind plant workers take their families out for movies and popcorn.
Jobs refers to the full-time-equivalent employment (calculated in job-years) caused by the development phase or aspect of the project in question.
Earnings is a dollar figure representing the wages, salaries, and benefits paid to the workers in the jobs.
Output refers to economic activity or the value of production in the state being analyzed. This dollar figure includes earnings, as well as the other revenue that results from the spending related to the project (purchases of equipment, materials and services).
Impacts of renewable energy development in Arizona
Arizona currently has 288 MW of wind capacity, 868 MW of solar PV capacity, and 286 MW of CSP capacity operating or under construction. The economic impacts of the construction and operation of these power plants are illustrated in the following figures and tables.
These job impacts, calculated using the JEDI model, include on-site jobs, jobs in the supply chain related to the project development or operation, and indirect jobs created by the additional employment on-site and in the supply chain.


Model validation
Because the model assumes that any service needed by the project is provided in-state if it is available in-state, it tends to over-estimate the economic impacts of technologies that do have manufacturing and other supply chain companies in the state. The actual reported economic impacts of several Arizona renewable energy power plants are listed below.
- Solana Generating Station, a 280-MW CSP plant with molten-salt energy storage in Maricopa County, built by Abengoa Solar, reported that during construction the project created 1500 direct jobs, and that there are 85 full time workers employed to operate the plant.
- Agua Caliente Solar, a 250-MW solar PV plant (290 planned at construction completion) in Yuma County, built by First Solar, employed 400 workers for four years during construction of all project phases.
- Dry Lake I, the first 63-MW phase of two wind plants in Navajo County developed by Iberdrola Renewables, reported a peak of 200 jobs during construction and 5 permanent on-site positions.
- Perrin Ranch, a 99-MW wind plant in Coconino County built by NextEra Energy, reported a peak of 200 construction jobs and 6 permanent positions on-site.
- Wind Power Plant
- Concentrated Solar Power Plant
- Solar Photovoltaic Plant