Introduction to the 2013 Wind & Solar Status Report
Background
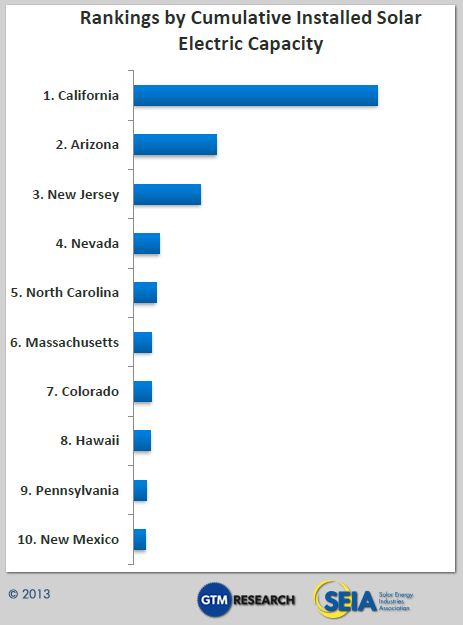
In 2013, Arizona found itself among the top producers of electricity from renewable sources in the United States, most notably from solar. The state’s Renewable Energy Standard and Tariff (REST), established in 2006, fostered demand for renewable energy projects; a number of large, longer-term projects were completed; and the successful completion of earlier wind and solar projects facilitated new developments. For its electricity generation statewide, however, Arizona continues to rely largely on coal, natural gas, and nuclear power.
This report is an update to the 2009 and 2011 Arizona Wind and Solar Status Reports, conducted by Northern Arizona University’s Landsward Institute and Institute for Sustainable Energy Solutions. Building on past reports, this work attempts to track and map all utility-scale renewable energy projects throughout the state. Our 2013 research found that the total utility-scale installed and under construction capacity stands at 1,137 MW for solar and 288 for wind. An additional 7,033 MW have been proposed or are under development statewide, yet may never be completed.
Trends in wind & solar
Solar development has outpaced the development of wind for a number of reasons. Clearly, there are abundant solar resources in Arizona, which are stronger and more reliable year-round than the state’s wind resources. This fact, along with policy incentives provided at the state and local level, has turned Arizona into a hub for solar energy innovation and development. National and foreign companies have been drawn to Arizona to pursue research, manufacturing, and project development. Net metering has supported strong growth for solar distributed generation (DG) for Arizona’s residential and commercial buildings. These factors have propagated over 100 significant manufacturing, development, and construction companies in the region whose work is focused on at least in part on renewable energy technology or development. Undeveloped, relatively flat land, ideal for solar development, is abundant and comparably inexpensive in Arizona. Furthermore, some farmers are finding it economical to sell or lease farm land, with associated water rights, to solar developers. Many state policymakers, including the Governor, recognize the potential economic benefits of becoming a renewable energy development hub. For all these reasons, Arizona has become a leader in solar development.
In contrast, wind energy development has seen slower growth. Arizona’s wind resource is not as strong or consistent as that in some neighbor states. Some aspects of permitting process for wind farms are more complicated and can take longer due to the fact that wind farms might cross several permitting jurisdictions, in addition to general concerns over avian and bat populations, visual impacts, and proximity to populations. Statewide wind modeling efforts, collaboration by environmental protection agencies at different jurisdictional levels, and the establishment of policies, guidelines, ordinances, and other guiding documents are all factors that help to accelerate the development of wind projects in Arizona.
Notable solar projects
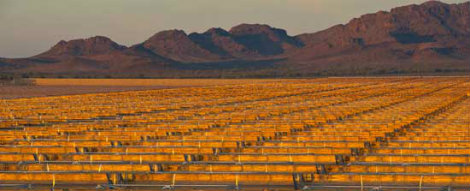
There are a number of notable concentrated solar power (CSP) and photovoltaic (PV) projects that came online in 2013. The Solana Generating Station in Maricopa County, completed in October 2013, is a CSP parabolic trough with generating capacity of 280 MW and storage capability to allow for electricity production into the night. APS will purchase 100 percent of the electricity produced. The Agua Caliente Solar Project located outside of Yuma is currently under construction and will be the world’s largest PV plant connected to the grid when completed, with capacity to generate 290 MW. This is being developed by First Solar, a Tempe-based manufacturer and developer of solar energy.
Notable wind projects
The Dry Lake I and II, Perrin Ranch, and Kingman I wind farms are the three operational wind farms in Arizona. In addition, the Red Horse 2 wind farm is under construction. These have a total generation capacity of 288 MW. Another 1 MW turbine is located on the Fort Huachuca Army Base. There are other projects that are approved or under development across the state. For example, the BLM is moving forward to approve the Mojave County Wind Farm, which will consist of as many as 243 turbines with 500 MW of total generating capacity.
Other renewable energy projects
Arizona can also utilize other renewable energy sources. Biomass and biogas have been cited as having potential throughout the state. Geothermal has potential, but to a lesser extent because geothermal wells are at a lower heat than needed for electricity production. Nevertheless, there have been some direct geothermal applications for aquaculture, heating systems, and farming. There are two biomass plants and two biogas plants in the state. The Snowflake biomass power plant is the largest in the state with operational capacity of 25 MW. After a brief closure in 2013, the plant is set to restart soon after being sold to Novo Power, LLC. A 2.8 MW biogas facility is operating in the city of Glendale and is powered by the methane captured from the landfill. Another biogas plant is being proposed in Glendale by Vieste Energy and Abengoa, a Spanish renewable energy company, would utilize waste-to-energy technology. This plant would gasify 180,000 tons of trash annually to produce 350 tons of gas a day to be burned to generate 15 MW of electricity.
Permitting
All renewable energy development projects must comply with applicable state, federal, and tribal laws, and with the guidance or regulation of the governing bodies having jurisdiction in the area of development. The state has 15 counties with differing or nonexistent rules for wind and solar development, and also is home to 22 federally recognized Native American tribes. The checkerboard layout of Arizona land means that there are often differing permitting processes for different projects across the state, and some projects must obtain multiple permits from different jurisdictions. As an example, the Dry Lake Wind Phase I development obtained Conditional Use and construction permits from Navajo County, a Right of Way from the State Land Department, and a Right of Way from the Bureau of Land Management. References to permitting guidelines are provided in an appendix to this report.
Native American communities
To date, there have not been any utility scale renewable energy projects constructed on tribal lands in Arizona. Several tribes have performed resource assessments and other feasibility work for utility-scale wind and solar development, including the Hualapai Tribe, Navajo Nation, Hopi Tribe and Fort Mojave tribe. Developers and tribes have been working for many years to address challenges with permitting, land ownership, and project ownership arrangements. There are a number of smaller scale projects, from solar street-lights to facility-scale renewable energy systems, installed in tribal communities across Arizona. Many of these provide renewable energy in places where there is no grid connection or where the renewable backup power contributes significantly to reliability of power or reduction in energy costs for tribal governments.
Market trends
The cost of solar and wind installations continues to fall. The Department of Energy’s (DOE) 2012 Wind Technologies Market Report indicated the cost of a wind farm installation, including turbine and installation, balance of plant costs, and any substation and interconnection costs, was around $1,940/kW in 2012; a $300/kW reduction since 2009/2010. According to the Solar Energy Industries Association (SEIA) the cost of solar installations also continues to decrease. Utility-scale solar system prices averaged around $2,070 per kW, yet the costs vary widely depending on technology, location, and other factors on a project-by-project basis.
These costs, along with operations and maintenance costs, capacity factors, development costs, transportation costs, siting and permit requirements, and construction costs and market conditions affect the Power Purchasing Agreement (PPA) pricing – the price at which wind and solar developers sell their electricity to utility companies. In 2012, the west had the highest average PPA price for wind in the country, at $50-$90 per MWh, whereas the national average was $40 per MWh.
Renewable energy standard
Since 2006, the Arizona Corporation Commission has enforced the Renewable energy Standard and Tarriff (REST). The REST mandates that investor-owned utility companies, and electric co-ops serving more than half of their retail customers in Arizona, generate 15% of their electricity from renewable sources by 2025. The required renewable energy generated as a percentage of total produced electricity increases incrementally each year. Out of the REST mandate for each year, 30% must be met by distributed generation (DG) sources. In 2013, the standard was set at 4%, and increases to 4.5% during 2014. To meet the standard, the utility companies must retain or obtain renewable energy credits (RECS) to represent the renewable energy attributes of eligible projects. The increasing percentage of this and other neighboring states’ standards creates demand for continued development of renewable energy in the region. As of the 2012 compliance reports, the major Arizona utility companies have been exceeding the REST requirements. APS had reported that 5.3% of total electricity retail sales came from renewables and exceeded the residential and nonresidential DG by 131% and 206% respectively. TEP reported similar figures; 5.2% of total retail electricity sales came from renewables and 118% of residential and 205% nonresidential of the standard has been met. Regulatory uncertainty has affected market stability in Arizona and the US as a whole. The Production Tax Credit (PTC), a 2.3 cent / kWh federal income tax credit, was due to expire in 2012, but was extended to the end of 2013, allowing all projects beginning in 2013 to collect on this tax incentive. The lack of long-term stability for this incentive creates uncertainty for the industry over time. The Business Energy Investment Tax Credit (ITC) provides tax breaks for up to 30% of the costs of installing solar, small scale wind, and other renewable energy technologies. The ITC has fueled growth in the solar sector, but will decrease significantly in 2017, which creates uncertainty, but also provides some more time to build economies of scale, enhance efficiency, and plan for a market without the credit.
Net-metering & deregulation
In 2013, two major issues in electricity market regulation were addressed by the Arizona Corporation Commission (ACC). First, the ACC opened a discussion docket on the topic of electricity market deregulation. A deregulated electricity market would create competition among utilities, by allowing consumers to select which company provides their electricity. This could have pushed electricity prices down as consumers sought out the cheapest options, or allowed consumers to choose providers based on other criteria such as who has the largest mix of renewables. The ACC docket accepted comments on deregulation’s potential impact form all interested parties. The ACC ultimately voted not to pursue deregulation at this time, maintaining the current utility service structure in Arizona. The second debated concerned net-metering. Arizona Public Service submitted a proposal for the ACC to amend the net-metering and distributed energy system to other consumers. To right this perceived wrong, APS proposed adding a monthly charge of $50-$100 to homes with DG installations. This could have had a crippling effect on rooftop solar and other distributed energy generating markets in Arizona, as they would have been made less economically feasible. The ACC rejected the large fees, instead opting for a $0.70 fee per month for each kW of DG capacity that the customer had on site.
Environmental issues
A number of environmental costs and benefits are weighed in decisions made regarding renewable energy development. Most renewables do not emit any CO2, the leading cause of climate change, during the production of electricity. For a kWh of renewable energy that is produced in place of natural gas and coal respectively, 1.2 lbs. or 2.2 lbs. of CO2 emissions are avoided. Thus, a 5 MW solar PV installation with a 20% capacity factor (average for Arizona), displaces 19.3 million lbs. of CO2 that would have otherwise been released into the atmosphere if the electricity were generated from coal. Also, avoiding the need for coal and natural gas also mitigates the environmental damages associated with coal mining and hydraulic fracturing.
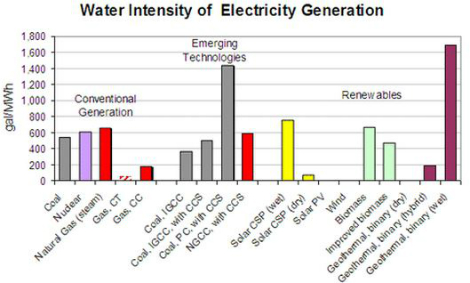
There are environmental concerns related to the manufacturing, construction, and operation of renewable energy facilities as well. In the southwest in particular, the use of and planning for water resources is extremely important. Wind and solar PV use almost no water in their operation, while CSP technologies continue to use steam generators and thus water for plant cooling. Renewable energy technologies also impact certain wildlife species. The habitat areas of Desert Tortoises, an endangered species, and other desert animals and plants, are subject to destruction, damage or fragmentation by large-scale solar developments. A number of avian and bat species, including the federally protected Golden Eagle, are put at risk by wind plants developed in areas where they roost or migrate. Increased awareness of risk, through pre-construction monitoring, and mitigation practices during and after construction, have been put in place to minimize these environmental costs.


